 Products Home
Calibrated Integrating Spheres
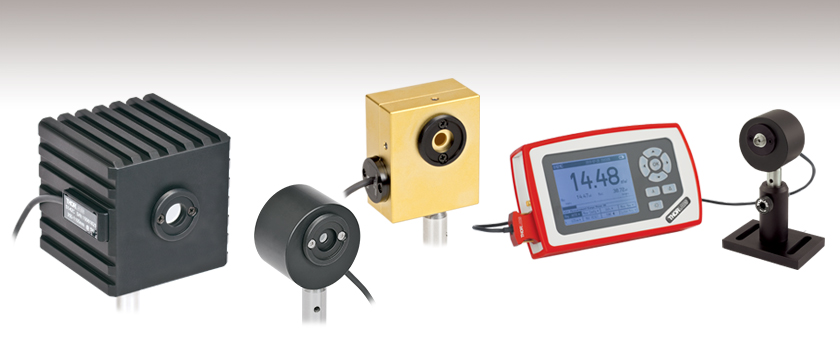
- Insensitive to Beam Shape, Input Angle, and Polarization
- Includes SM1-Threaded Adapter for Fiber-Coupled Input
- NIST- or PTB-Traceable Calibration
S142C
350 - 1100 nm
(Post Not Included)
S144C
800 - 1700 nm
(Post Not Included)
Application Idea
PM100D Power Meter Console and S140C Integrating Sphere Shown with Included FC/PC and FC/APC Adapter (Post, Post Holder, and Base Not Included)
S140C
PM100D
S180C
2.9 - 5.5 µm
(Post Not Included)


Please Wait
Compatible Power Meter Consoles
PM100D: Handheld Power and Energy Meter Console with a Large Liquid Crystal Display
PM100A: Handheld Power Meter Console with an Analog Needle and Small Digital Display
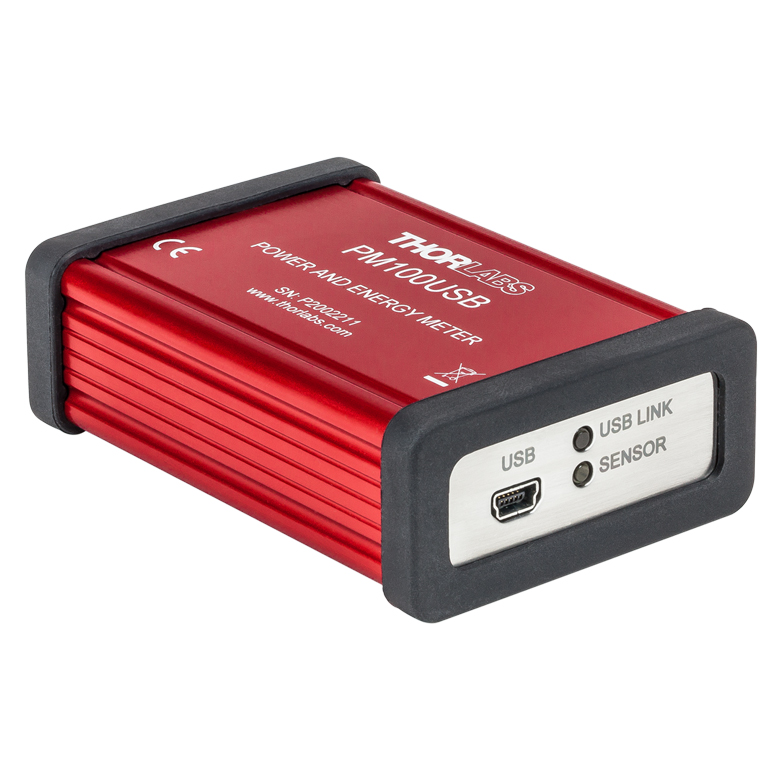
PM100USB: USB Computer Interface for Power Sensors, No Display
PM400: Touchscreen Power and Energy Meter Console with Color Display and Multi-Touch
PM320E: Dual Channel Digital Benchtop Power Meter Console with a Large LCD Display
See the Console Selection tab for more information on compatible console options. These sensors may also be used with our previous generation PM200 console.
Features
- For Measurements Independent of Beam Shape and Entrance Angle
- Integrating Sphere Design Acts as a Diffuser with Minimal Power Loss
- Ø5 mm, Ø7 mm, or Ø12 mm Input Aperture
- Individually Calibrated with NIST- or PTB-Traceable Certificate of Calibration
- Over-Temperature Alert Sensor
- Removable S120-FC Fiber Adapter (FC/PC and FC/APC) Included
- Additional Fiber Adapters Available Separately (See Below)
- C-Series Connector Design for Quick Sensor Connection
- Recalibration Services Available
Integrating spheres are designed to provide precise optical power measurements independent of beam shape, entrance angle, and polarization. These photodiode sensors have a faster response time than thermal sensor heads while also offering a high damage threshold. These integrating spheres feature enhanced shielding to avoid electromagnetic interference and an over-temperature alert sensor to warn against damage and measurement errors due to overheating of the sensor.
Our integrating spheres are designed for wavelength ranges from the visible through the NIR. Sensor heads for use between 350 and 2500 nm use a single Ø1" or Ø2" sphere made from Zenith® PTFE and feature a black housing to minimize reflected light around the entrance aperture. These sensors use either a silicon photodiode for detection in the 350 - 1100 nm range or an InGaAs photodiode for detection in the 800 - 1700 nm, 900 - 1650 nm, or 1200 - 2500 nm wavelength range. The integrating sphere housing has separate 8-32 and M4 taps that can be used to mount the sensor on a standard Ø1/2" post (not included).
The S180C integrating sphere for 2.9 - 5.5 µm uses two connected, gold-plated Ø20 mm spheres, with an entrance port in the first sphere and a port for the MCT (HgCdTe) detector located in the second sphere. Compared to single-sphere designs, the two-sphere configuration improves device sensitivity by minimizing the internal sphere surface area while still effectively shielding the detector from direct illumination. This design reduces the effect of input angle, divergence, and beam shape on the measurement result by effectively shielding the photodiode without the use of a baffle or other shielding mechanism. The integrating sphere housing has one universal 8-32 and M4 tap that can be used to mount the sensor on a standard Ø1/2" post (not included).
Each integrating sphere includes an adapter with external SM1 (1.035"-40) threads as well as an S120-FC fiber adapter for compatibility with FC/PC- and FC/APC-terminated patch cables, supporting easy integration with both free-space and fiber-coupled setups. Additional fiber adapters for other connector types are available separately below. The externally SM1-threaded adapter can be removed using a size 1 screwdriver to place components closer to the window.
Compatibility and Calibration
These integrating spheres have C-Series connectors for compatibility with Thorlabs' line of power meter consoles; compatible consoles are outlined in the box above and details are provided on the Console Selection tab. Each sensor head is individually calibrated and is shipped with NIST- or PTB-traceable calibration data. The included data will match the calibration certification of the photodiode used to test the individual sensor. The calibration data and sensor identification information is stored in the red connector and read out automatically when the sensor is connected to a compatible Thorlabs power meter console.
Thorlabs also offers power sensor heads in a wide range of other formats as well as complete power meters that combine a sensor head and power meter electronics in a compact package. Our complete line of sensor heads, power meter consoles, and complete power meters is available here.
Recalibration Services
Thorlabs offers recalibration services for our integrating sphere power sensors. To ensure accurate measurements, we recommend recalibrating the sensors annually. To order this service, scroll to the bottom of the page and select the appropriate Item # that corresponds to your sensor.
| Item # | S140C | S142C | S144C | S145C | S146C | S148C | S180C |
|---|---|---|---|---|---|---|---|
| Technical Specs | |||||||
| Detector Type | Silicon Photodiode | InGaAs Photodiode | MCT (HgCdTe) Photodiode |
||||
| Wavelength Range | 350 nm - 1100 nm | 800 nm - 1700 nm | 900 nm - 1650 nm | 1200 - 2500 nm | 2.9 µm - 5.5 µm | ||
| Optical Power Range | 1 µW - 500 mW | 1 µW - 5 W | 1 µW - 500 mW | 1 µW - 3 W | 10 µW - 20 W | 1 µW - 1 W | 1 µW - 3 W |
| Max Average Power Density |
1 kW/cm² | 2 kW/cm² | 1 kW/cm² | 2 kW/cm² | 1 kW/cm² | ||
| Max Pulse Energy Density |
1 J/cm² | 7 J/cm² | 1 J/cm² | 7 J/cm² | 1 J/cm² | ||
| Linearity | ±0.5% | ||||||
| Resolutiona | 1 nW | 1 nW | 10 nW | 1 nW | 10 nW | ||
| Measurement Uncertaintyb |
±3% (440 - 980 nm) ±5% (350 - 439 nm) ±7% (981 - 1100 nm) |
±5% | |||||
| Responsivityc (Click for Plot) |
 Raw Data |
 Raw Data |
 Raw Data |
 Raw Data |
 Raw Data |
 Raw Data |
| General Information | |||||||
| Typical Application | Low-Power Lasers / Fiber Lasers |
Low- and Mid-Power Lasers / Fiber Lasers |
Low-Power Lasers / Fiber Lasers |
Low- and Mid-Power Lasers / Fiber Lasers | |||
| Laser Types | Diode, He-Cd, |
QCL, ICL, HeNe, CO, Er:YAG, Co2+:ZnS |
|||||
| Integrating Sphere Material (Size) |
Zenith® PTFE (Ø1") |
Zenith® PTFE (Ø2") |
Zenith® PTFE (Ø1") |
Zenith® PTFE (Ø2") |
Zenith® PTFE (Ø1") |
Gold Plating (Two Ø20 mm Spheres) |
|
| Cooling | Convection | ||||||
| Head Temperature Measurement |
NTC Thermistor, 4.7 kΩ | ||||||
| Console Compatibilityd | PM100D, PM100A, PM100USB, PM400, and PM320E | ||||||
| Response Time | <1 µs | ||||||
| Mechanical Specs | |||||||
| Housing Dimensions | Ø45.0 mm x 30.5 mm (Ø1.77" x 1.20") |
70.0 mm x 74.0 mm x 70.0 mm (2.76" x 2.91" x 2.76") |
Ø45.0 mm x 30.5 mm (Ø1.77" x 1.20") |
70.0 mm x 74.0 mm x 70.0 mm (2.76" x 2.91" x 2.76") |
Ø45.0 mm x 30.5 mm (Ø1.77" x 1.20") |
59.0 mm x 50.0 mm x 28.5 mm |
|
| Active Sensor Area | 3.6 mm x 3.6 mm | 3.6 mm x 3.6 mm | 3.6 mm x 3.6 mm | Ø2 mm | Ø1 mm | Ø1 mm | 1 mm x 1 mm |
| Sensor Aperture | Ø5 mm | Ø12 mm | Ø5 mm | Ø12 mm | Ø12 mm | Ø5 mm | Ø7 mm |
| Cable Length | 1.5 m | ||||||
| Connector | Male 9-Pin D-Sub | ||||||
| Weight | 0.2 kg | 0.6 kg | 0.2 kg | 0.6 kg0.6 kg | 0.2 kg | 0.25 kg | |
| Mounting and Accessories | |||||||
| Mounting Thread | Separate 8-32 and M4 Taps, Posts Not Included | Universal 8-32 / M4 Tap, Post Not Included | |||||
| Aperture Thread | Included Adapter with External SM1 (1.035"-40) Thread | ||||||
| Fiber Adapters (Optional) | FC (Included), SMA, ST, LC, SC, Bare Fiber | ||||||
Sensor Connector
D-Type Male

| Pin | Connection |
|---|---|
| 1 | Not Used |
| 2 | EEPROM Digital I/O |
| 3 | Photodiode Anode and NTC Ground |
| 4 | Photodiode Cathode |
| 5 | Not Used |
| 6 | EEPROM Ground |
| 7 | NTC |
| 8 | Not Used |
| 9 | Not Used |
Thorlabs offers a wide selection of power and energy meter consoles and interfaces for operating our power and energy sensors. Key specifications of all of our power meter consoles and interfaces are presented below to help you decide which device is best for your application. We also offer self-contained wireless power meters and compact USB power meters.
When used with our C-series sensors, Thorlabs' power meter consoles and interfaces recognize the type of connected sensor and measure the current or voltage as appropriate. Our C-series sensors have responsivity calibration data stored in their connectors. The console will read out the responsivity value for the user-entered wavelength and calculate a power or energy reading.
- Photodiode sensors deliver a current that depends on the input optical power and the wavelength. The current is fed into a transimpedance amplifier, which outputs a voltage proportional to the input current. The photodiode's responsivity is wavelength dependent, so the correct wavelength must be entered into the console for an accurate power reading. The console reads out the responsivity for this wavelength from the connected sensor and calculates the optical power from the measured photocurrent.
- Thermal sensors deliver a voltage proportional to the input optical power. Based on the measured sensor output voltage and the sensor's responsivity, the console will calculate the incident optical power.
- Energy sensors are based on the pyroelectric effect. They deliver a voltage peak proportional to the pulse energy. If an energy sensor is recognized, the console will use a peak voltage detector and the pulse energy will be calculated from the sensor's responsivity.
The consoles and interfaces are also capable of providing a readout of the current or voltage delivered by the sensor. Select models also feature an analog output.
Consoles
| Item # | PM100A | PM100D | PM400 | PM320E |
|---|---|---|---|---|
| (Click Photo to Enlarge) |  |
 |
 |
 |
| Key Features | Analog Power Measurements | Digital Power and Energy Measurements | Digital Power and Energy Measurements, Touchscreen Control | Dual Channel |
| Compatible Sensors | Photodiode and Thermal Power | Photodiode and Thermal Power; Pyroelectric | ||
| Housing Dimensions (H x W x D) |
7.24" x 4.29" x 1.61" (184 mm x 109 mm x 41 mm) |
7.09" x 4.13" x 1.50" (180 mm x 105 mm x 38 mm) |
5.35" x 3.78" x 1.16" (136.0 mm x 96.0 mm x 29.5 mm) |
4.8" x 8.7" x 12.8" (122 mm x 220 mm x 325 mm) |
| Channels | 1 | 2 | ||
| External Temperature Sensor Input (Sensor not Included) | - | - | Instantaneous Readout and Record Temperature Over Time | - |
| External Humidity Sensor Input (Sensor not Included) | - | - | Instantaneous Readout and Record Humidity Over Time | - |
| GPIO Ports | - | 4, Programmable | - | |
| Source Spectral Correction | - | - | - | |
| Attenuation Correction | - | - | - | |
| External Trigger Input | - | - | - | |
| Display | ||||
| Type | Mechanical Needle and LCD Display with Digital Readout | 320 x 240 Pixel Backlit Graphical LCD Display | Protected Capacitive Touchscreen with Color Display | 240 x 128 Pixels Graphical LCD Display |
| Dimensions | Digital: 1.9" x 0.5" (48.2 mm x 13.2 mm) Analog: 3.54" x 1.65" (90.0 mm x 42.0 mm) |
3.17" x 2.36" (81.4 mm x 61.0 mm) |
3.7" x 2.1" (95 mm x 54 mm) |
3.7" x 2.4" (94.0 mm x 61.0 mm) |
| Refresh Rate | 20 Hz | 10 Hz (Numerical) 25 Hz (Analog Simulation) |
20 Hz | |
| Measurement Viewsa | ||||
| Numerical | ||||
| Mechanical Analog Needle | - | - | - | |
| Simulated Analog Needle | - | |||
| Bar Graph | - | |||
| Trend Graph | - | |||
| Histogram | - | - | ||
| Statistics | ||||
| Memory | ||||
| Type | - | SD Card | NAND Flash | - |
| Size | - | 2 GB | 4 GB | - |
| Power | ||||
| Battery | LiPo 3.7 V 1300 mAh | LiPo 3.7 V 2600 mAh | - | |
| External | 5 VDC via USB or Included AC Adapter | 5 VDC via USB | Selectable Line Voltage: 100 V, 115 V, 230 V (±10%) | |
Interfaces
| Item # | PM101 | PM102 | PM101A | PM102A | PM101R | PM101U | PM102U | PM100USB |
|---|---|---|---|---|---|---|---|---|
| (Click Photo to Enlarge) |  |
 |
 |
 |
 |
 |
 |
 |
| Key Features | USB, RS232, UART, and Analog Operation |
USB and Analog SMA Operation | USB and RS232 Operation | USB Operation | USB Operation | |||
| Compatible Sensors | PM101 Series: Photodiode and Thermal Power PM102 Series: Thermal Power and Thermal Position & Power |
Photodiode and Thermal Power; Pyroelectric |
||||||
| Housing Dimensions (H x W x D) |
3.80" x 2.25" x 1.00" (96.5 x 57.2 x 25.4 mm) |
3.94" x 2.25" x 1.00" (100.0 x 57.2 x 25.4 mm) |
3.78" x 2.25" x 1.00" (95.9 x 57.2 x 25.4 mm) |
3.68" x 2.25" x 1.00" (93.6 x 57.2 x 25.4 mm) |
3.67" x 2.38 " x 1.13" (93.1 x 60.4 x 28.7 mm) |
|||
| Channels | 1 | |||||||
| External Temperature Sensor Input (Sensor Not Included) |
NTC Thermistor | - | ||||||
| External Humidity Sensor Input (Sensor not Included) |
- | |||||||
| GPIO Ports | - | |||||||
| Source Spectral Correction | - | |||||||
| Attenuation Correction | - | |||||||
| External Trigger Input | - | |||||||
| Display | ||||||||
| Type | No Built-In Display; Controlled via GUI for PC | |||||||
| Refresh Rate | Up to 1000 Hza | Up to 300 Hza | ||||||
| Measurement Viewsb | ||||||||
| Numerical | Requires PCb | |||||||
| Mechanical Analog Needle | - | |||||||
| Simulated Analog Needle | Requires PCb | |||||||
| Bar Graph | Requires PCb | |||||||
| Trend Graph | Requires PCb | |||||||
| Histogram | Requires PCb | |||||||
| Statistics | Requires PCb | |||||||
| Memory | ||||||||
| Type | Internal Non-Volatile Memory for All Settings | - | ||||||
| Size | - | |||||||
| Power | ||||||||
| Battery | - | |||||||
| External | 5 VDC via USB or 5 to 36 VDC via DA-15 |
5 VDC via USB | ||||||

Insights into Best Lab Practices
Scroll down to read about things to consider when building integrating spheres into setups and analyzing data results.
- Ultraviolet and Blue Fluorescence Emitted by Integrating Spheres
- Sample Substitution Errors
Click here for more insights into lab practices and equipment.
Ultraviolet and Blue Fluorescence Emitted by Integrating Spheres

Click to Enlarge
Figure 1: Typical yields at each wavelength are around four orders of magnitude lower than the excitation wavelength. [4]
The spectral fluorescence yield relates the intensity of the fluorescence emitted within the integrating sphere with the intensity of the excitation wavelength. The yield is calculated by dividing the wavelength-dependent, total fluorescence excited over the entire interior surface of the sphere by the intensity of the light excitation.
Data were kindly provided by Dr. Ping-Shine Shaw, Physics Laboratory, National Institute of Standards and Technology, Gaithersburg, MD 20899, USA.
A material of choice for coating the light-diffusing cavities of integrating spheres is polytetrafluoroethylene (PTFE). This material, which is white in appearance, is favored for reasons including its high, flat reflectance over a wide range of wavelengths (see the Specs tab for details) and chemical inertness.
However, it should be noted that integrating spheres coated with both PTFE and barium sulfate, which is an alternative coating with lower reflectance, emit low levels of ultraviolet (UV) and blue fluorescence when irradiated by UV light. [1-3]
Hydrocarbons in the PTFE Fluoresce
It is not the PTFE that fluoresces. The sources of the UV and blue fluorescence are hydrocarbons in the PTFE. Low levels of hydrocarbon impurities are present in the raw coating material, and pollution sources deposit additional hydrocarbon contaminants in the PTFE material of the integrating sphere during its use and
Fluorescence Wavelength Bands and Strength
Researchers at the National Institute of Standards and Technology (NIST) have investigated the fluorescence excited by illuminating PTFE-coated integrating spheres. The total fluorescence output by the integrating sphere was measured with respect to fluorescence wavelength and excitation wavelength. The maximum fluorescence was approximately four orders of magnitude lower than the intensity of the exciting radiation.
The UV and blue fluorescence from PTFE is primarily excited by incident wavelengths in a 200 nm to 300 nm absorption band. The fluorescence is emitted in the 250 nm to 400 nm wavelength range, as shown by Figure 1. These data indicate that increasing the excitation wavelength decreases the fluorescence emitted at lower wavelengths and changes the shape of the fluorescence spectrum.
As the levels of hydrocarbon contaminants in the PFTE increase, fluorescence increases. A related effect is a decrease of the light output by the integrating sphere over the absorption band wavelengths, due to more light from this spectral region being absorbed. [1, 3]
Impact on Applications
The UV and blue fluorescence from the PTFE has negligible effect on many applications, since the intensity of the fluorescence is low and primarily excited by incident wavelengths <300 nm. Applications sensitive to this fluorescence include long-term measurements of UV radiation throughput, UV source calibration, establishing UV reflectance standards, and performing some UV remote sensing tasks. [1]
Minimizing Fluorescence Effects
Minimizing and stabilizing the fluorescence levels requires isolating the integrating sphere from all sources of hydrocarbons, including gasoline- and diesel-burning engine exhaust and organic solvents, such as naphthalene and toluene. It should be noted that, while hydrocarbon contamination can be minimized and reduced, it cannot be eliminated. [1]
Since the history of each integrating sphere's exposure to hydrocarbon contaminants is unique, it is not possible to predict the response of a particular sphere to incident radiation. When an application is negatively impacted by the fluorescence, calibration of the integrating sphere is recommended. A calibration procedure described in [4] requires a light source with a well-known spectrum that extends across the wavelength region of interest, such as a deuterium lamp or synchrotron radiation, a monochromator, a detector, and the integrating sphere.
References
[1] Ping-Shine Shaw, Zhigang Li, Uwe Arp, and Keith R. Lykke, "Ultraviolet characterization of integrating spheres," Appl.Opt. 46, 5119-5128 (2007).
[2] Jan Valenta, "Photoluminescence of the integrating sphere walls, its influence on the absolute quantum yield measurements and correction methods," AIP Advances 8, 102123 (2018).
[3] Robert D. Saunders and William R. Ott, "Spectral irradiance measurements: effect of UV-produced fluorescence in integrating spheres," Appl. Opt. 15, 827-828 (1976).
[4] Ping-Shine Shaw, Uwe Arp, and Keith R. Lykke, "Measurement of the ultraviolet-induced fluorescence yield from integrating spheres," Metrologia 46, S191 - S196 (2009).
Date of Last Edit: Dec. 4, 2019
Sample Substitution Errors


Click to Enlarge
Figure 2: Measuring diffuse sample transmittance and reflectance as shown above can result in a distorted sample spectrum due to sample substitution error. The problem is that the reflectivity over the sample area is different during the reference and sample measurements.

Click to Enlarge
Figure 3: The above configuration is not susceptible to sample substitution error, since the interior of the sphere is the same for reference and sample measurements. During the reference measurement the light travels along (R), and no light is incident along (S). The opposite is true when a sample measurement is made.
Absolute transmittance and absolute diffuse reflectance spectra of optical samples can be found using integrating spheres. These spectra are found by performing spectral measurements of both the sample of interest and a reference.
Measurement of a reference is needed since this provides the spectrum of the illuminating light source. Obtaining the reference scan allows the spectrum of the light source to be subtracted from the sample measurement.
The light source reference measurement is made with no sample in place for transmittance data and with a highly reflective white standard reference sample in place for reflectance measurements.
Sample substitution errors incurred while acquiring the sample and reference measurement sets can negatively effect the accuracy of the corrected sample spectrum, unless the chosen experimental technique is immune to these errors.
Conditions Leading to Sample Substitution Errors
An integrating sphere's optical performance depends on the reflectance at each point on its entire inner surface. Often, a section of the sphere's inner wall is replaced by the sample when its transmittance and diffuse reflectance spectra are measured (Figure 2). However, modifying a section of the inner wall alters the performance of the integrating sphere.
Sample substitution errors are a concern when the measurement procedure involves physically changing one sample installed within the sphere for another. For example, when measuring diffuse reflectance (Figure 2, bottom), a first measurement might be made with the standard reference sample mounted inside the sphere. Next, this sample would be removed and replaced by the sample of interest, and a second measurement would be acquired. Both data sets would then be used to calculate the corrected absolute diffuse reflectance spectrum of the sample.
This procedure would result in a distorted absolute sample spectrum. Since the sample of interest and the standard reference have different absorption and scattering properties, exchanging them alters the reflectivity of the integrating sphere over the samples' surface areas. Due to the average reflectivity of the integrating sphere being different for the two measurements, they are not perfectly compatible.
Solution Option: Install Sample and Reference Together
One experimental technique that avoids sample substitution errors acquires measurement data when both sample and reference are installed inside the integrating sphere at the same time. This approach requires an integrating sphere large enough to accomodate the two, as additional ports.
The light source is located external to the integrating sphere, and measurements of the sample and standard reference are acquired sequentially. The specular reflection from the sample, or the transmitted beam, is often routed out of the sphere, so that only the diffuse light is detected. Since the inner surface of the sphere is identical for both measurements, sample substitution errors are not a concern.
Alternate Solution Option: Make Measurements from Sample and Reference Ports
If it is not possible to install both sample and standard references in the integrating sphere at the same time, it is necessary to exchange the installed sample. If this must be done, sample substitution errors can be removed by following the procedure detailed in [1].
This procedure requires a total of four measurements. When the standard sample is installed, measurements are made from two different ports. One has a field of view that includes the sample and the other does not. The sample of interest is then subsituted in and the measurements are repeated. Performing the calculations described in [1] using these measurements removes the sample substitution errors.
References
[1] Luka Vidovic and Boris Majaron, "Elimination of single-beam substitution error in diffuse reflectance measurements using an integrating sphere," J. Biomed.Opt. 19, 027006 (2014).
Date of Last Edit: Dec. 4, 2019
| Posted Comments: | |
jvigroux
(posted 2012-09-18 03:54:00.0) A response form Julien at Thorlabs: Thank you for your feedback! we can offer such integrating sphere on request. We do not offer it as a standard product yet because the calibration is only made up to 1.8µm plus one extra point at 2µm. For the rest of the range, we fit the theoretical curve of the sensitivity onto the calibrated part in order to extrapolate the responsivity above 2µm. simon.gross
(posted 2012-09-14 22:42:18.0) Why don't you guys equip an integrated sphere with and extended InGaAs sensor for the 2 um wavelength range? This would be a very useful power meter, as it is significantly more sensitive than thermal detectors and won't pick up any thermal radiation.
Cheers |

Click to Enlarge
The PM160 wireless power meter, shown here with an iPad mini (not included), can be remotely operated using Apple mobile devices.
This tab outlines the full selection of Thorlabs' power and energy sensors. Refer to the lower right table for power meter console and interface compatibility information.
In addition to the power and energy sensors listed below, Thorlabs also offers all-in-one, wireless, handheld power meters and compact USB power meter interfaces that contain either a photodiode or a thermal sensor, as well as power meter bundles that include a console, sensor head, and post mounting accessories.
Thorlabs offers four types of sensors:
- Photodiode Sensors: These sensors are designed for power measurements of monochromatic or near-monochromatic sources, as they have a wavelength dependent responsivity. These sensors deliver a current that depends on the input optical power and the wavelength. The current is fed into a transimpedance amplifier, which outputs a voltage proportional to the input current.
- Thermal Sensors: Constructed from material with a relatively flat response function across a wide range of wavelengths, these thermopile sensors are suitable for power measurements of broadband sources such as LEDs and SLDs. Thermal sensors deliver a voltage proportional to the input optical power.
- Thermal Position & Power Sensors: These sensors incorporate four thermopiles arranged as quadrants of a square. By comparing the voltage output from each quadrant, the unit calculates the beam's position.
- Pyroelectric Energy Sensors: Our pyroelectric sensors produce an output voltage through the pyroelectric effect and are suitable for measuring pulsed sources, with a repetition rate limited by the time constant of the detector. These sensors will output a peak voltage proportional to the incident pulse energy.
| Console Compatibility | |||||||
|---|---|---|---|---|---|---|---|
| Console Item # | PM100A | PM100D | PM400 | PM320E | PM101 Series |
PM102 Series |
PM100USB |
| Photodiode Power |  |
|
|
|
|
- | |
| Thermal Power | |
|
|
|
|
|
|
| Thermal Position | - | - | |
- | - | |
- |
| Pyroelectric Energy | - | |
|
|
- | - | |
Power and Energy Sensor Selection Guide
There are two options for comparing the specifications of our Power and Energy Sensors. The expandable table below sorts our sensors by type (e.g., photodiode, thermal, or pyroelectric) and provides key specifications.
Alternatively, the selection guide graphic further below arranges our entire selection of photodiode and thermal power sensors by wavelength (left) or optical power range (right). Each box contains the item # and specified range of the sensor. These graphs allow for easy identification of the sensor heads available for a specific wavelength or power range.
| Photodiode Power Sensors |
|---|


| Thermal Power Sensors |
|---|


| Thermal Position & Power Sensors |
|---|


| Pyroelectric Energy Sensors |
|---|


Sensor Options
(Arranged by Wavelength Range)

Sensor Options
(Arranged by Power Range)


| Item #a,b | Detector Type |
Wavelength Range |
Optical Power Range |
Max Average Power Density |
Max Pulse Energy Density |
Resolution | Integrating Sphere Material (Size) |
Input Aperture |
|---|---|---|---|---|---|---|---|---|
| S140C | Silicon Photodiode |
350 nm - 1100 nm | 1 µW - 500 mW | 1 kW/cm² | 1 J/cm² | 1 nW | Zenith® PTFE (Ø1") | Ø5 mm |
| S142C | 350 nm - 1100 nm | 1 µW - 5 W | 2 kW/cm² | 7 J/cm² | 1 nW | Zenith® PTFE (Ø2") | Ø12 mm | |
| S144C | InGaAs Photodiode |
800 nm - 1700 nm | 1 µW - 500 mW | 1 kW/cm² | 1 J/cm² | 1 nW | Zenith® PTFE (Ø1") | Ø5 mm |
| S145C | 800 nm - 1700 nm | 1 µW - 3 W | 2 kW/cm² | 7 J/cm² | 1 nW | Zenith® PTFE (Ø2") | Ø12 mm | |
| S146C | 900 nm - 1650 nm | 10 µW - 20 W | 2 kW/cm² | 7 J/cm² | 10 nW | Zenith® PTFE (Ø2") | Ø12 mm | |
| S148C | 1200 nm - 2500 nm | 1 µW - 1 W | 1 kW/cm² | 1 J/cm² | 1 nW | Zenith® PTFE (Ø1") | Ø5 mm | |
| S180C | MCT (HgCdTe) Photodiode |
2.9 µm - 5.5 µm | 1 µW - 3 W | 1 kW/cm² | 1 J/cm² | 10 nW | Gold Plating (Two Ø20 mm Spheres) |
Ø7 mm |
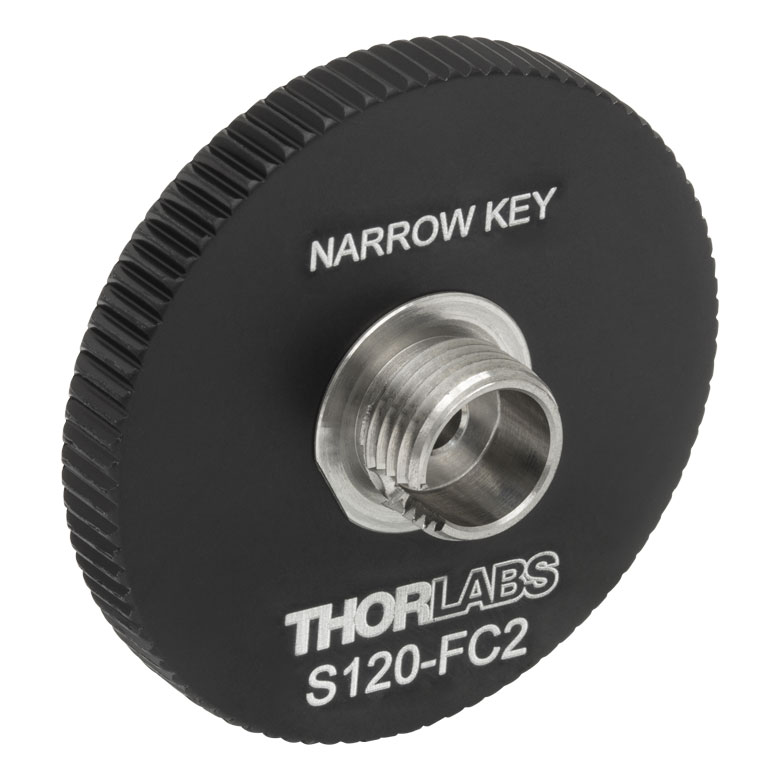
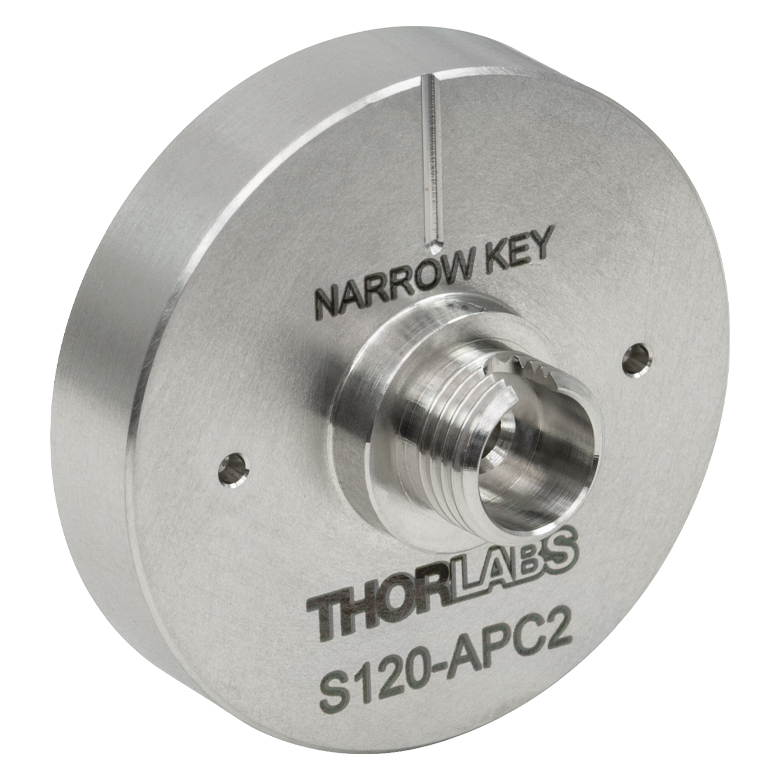
| Item # | S120-FC2 | S120-FCa | S120-APC2b | S120-APCb | S120-SMA | S120-ST | S120-SC | S120-LC | S140-BFA |
|---|---|---|---|---|---|---|---|---|---|
| Adapter Image (Click Image to Enlarge) |
 |
 |
 |
 |
 |
 |
 |
 |
 |
| Fiber Termination |
FC/PC, 2.0 mm Narrow Keyc |
FC/PC, 2.2 mm Wide Keyc |
FC/APC, 2.0 mm Narrow Keyc |
FC/APC, 2.2 mm Wide Keyc |
SMA | ST/PC | SC/PCd | LC/PC | Bare Fiber with Ø250 to Ø450 µm Buffere |
| Thread / Screws | Internal SM1 (1.035"-40) Thread | Two M2.5 x 4 Screwsf | |||||||