 Products Home
Erbium-Doped Fiber Amplifiers (EDFA)

- Saturation Output Power of >20 dBm
- Noise Figure of <5 dB
- For CW and Ultrafast Pulse Amplification
- Simple, Turnkey Operation
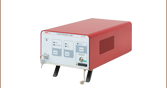
EDFA100P
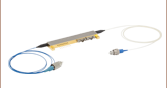
Polarization-Maintaining EDFA
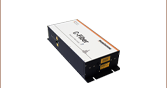
EDFA100S
Single Mode EDFA


Please Wait

Click to Enlarge
This plot gives the wavelength-dependent output power as a function of input power for our polarization-maintaining EDFA. A complete set of performance graphs is available on the Graphs tab.
Features
- Operating Wavelength Range: 1530 - 1565 nm (C-Band)
- Available in Two Versions
- Single Mode EDFA with >30 dB Small Signal Gain and <0.2 dB Polarization-Dependent Gain
- Polarization-Maintaining EDFA with >28 dB Small Signal Gain and >25 dB Polarization Extinction Ratio
- Ideal for Use as a Preamplifier for CW and Ultrafast Applications
- Front Panel Controls and Remote Control Over USB
- <0.06 ps/nm Dispersion Within Amplifier to Minimize Pulse Broadening
- Custom Dispersion-Compensating Patch Cables are Available Upon Request; Contact Tech Support for Details
Thorlabs' core-pumped erbium-doped fiber amplifiers (EDFAs) offer >20 dBm (>100 mW) output power with a low noise figure of <5 dB. They are enclosed in a compact, turnkey benchtop package with FC/APC input and output connectors. The EDFA100S is a single mode EDFA with minimal sensitivity to the light polarization, while the EFDA100P is a polarization-maintaining EDFA that only amplifies light polarized along the slow axis of the fiber. Each EDFA includes built-in input and output isolators. In order to support applications involving femtosecond pulses, they are engineered to impart minimal dispersion. The fs Pulse Amplification tab contains more details on femtosecond operation. In addition, dispersion-compensating patch cables for the EDFAs or with custom dispersion compensation are available upon request; please contact Tech Support for more information.
The pump current of the erbium-doped fiber amplifier is adjustable through the instrument's front panel, allowing the user to vary the gain and output power of the amplifier. In addition, remote control of the pump current is supported by sending serial commands via a USB 2.0 connector. For added safety, the user may connect an interlock circuit to the 2.5 mm mono jack on the rear panel.
Each EDFA uses a universal power supply allowing operation over 100 - 240 VAC, 50 - 60 Hz without the need to select the line voltage. A region-specific power cord is included.

Click to Enlarge
EDFA100P Front Panel
The front panel of the EDFA includes a digital display, a rotating knob that adjusts the pump laser current, a key switch, and an amplifier enable switch button paired to a green LED.

Click to Enlarge
EDFA100P Back Panel
The back panel of the EDFA includes a USB type B connector for remote operation and a 2.5 mm mono jack for a user-designed interlock circuit.
Unless otherwise indicated, all specifications below are valid for CW inputs only.
| Item # | EDFA100S | EDFA100P |
|---|---|---|
| Amplifier Specifications (@ 1000 mA Pump Current) | ||
| Operating Wavelength Rangea | 1530 - 1565 nm | |
| Output Powerb,c (@ 3 dBm Input Power) | >20 dBm | |
| Small Signal Gainb (@ -20 dBm Input Power) | >30 dB | >28 dB |
| Noise Figureb (@ 3 dBm Input Power) | <5 dB | |
| Output Power Stability (@ 3 dBm Input Power) |
<±2% Over 24 Hours (After 15 Minute Warm-Up, for Ambient Temperature ±2 °C) |
|
| Total Dispersion Within Amplifierd | <0.06 ps/nm | |
| Laser Class | 3B | |
| Fiber Specifications | ||
| Output Polarization | Random | Linear, Aligned to Slow Axis |
| Polarization Extinction Ratio | N/A | >25 dB |
| Polarization-Dependent Gain | <0.2 dB | N/A |
| Return Loss at Input Port | >50 dB | |
| Input / Output Isolation | >30 dB | |
| Input / Output Fiber Type | SMF-28-J9 | PM1550-XP |
| Input / Output Fiber Connectors | FC/APC Compatible, 2.0 mm Narrow Key |
|
| Absolute Maximum Ratings | |
|---|---|
| Absolute Maximum Input Power | 10 dBm |
| Absolute Maximum Output Power | 23 dBm |
| Operating Temperature | 15 to 35 °C |
| Storage Temperature | 0 to 50 °C |
| General Specifications | |
|---|---|
| Input Voltage | 100 - 240 VAC, 50 - 60 Hz |
| Input Power | 20 VA (Max) |
| Fuse Rating | 500 mA |
| Fuse Type | IEC60127-2/III (250 VA, Slow Blow Type "T") |
| Dimensions (W x H x D) | 5.76" x 3.06" x 12.16" (146.3 mm x 77.7 mm x 308.9 mm) |
| Weight | 2.08 kg (4.58 lbs) |
| Connections and Controls | |
| Interface Control | Optical Encoder with Push Button |
| Enable Select | Keypad Switch Enable with LED Indicator |
| Power On | Key Switch |
| Fiber Connectors | FC/APC Compatible, 2.0 mm Narrow Key |
| Input Power Connector | IEC Connector |
| Interlock | 2.5 mm Mono Jack |
| Communications | |
| Communications Port | USB 2.0 Compatible |
| COM Connection | USB Type B Connector |
| Required Cable | USB Type A to Type B Cable (Replacement Item # USB-A-79) |
Performance Graphs
Unless otherwise stated, all performance graphs below were obtained using a CW input, the maximum pump current of 1000 mA, and the factory pump temperature setting of 25 °C. This data reflects the typical performance of our EDFAs, and is presented for reference only. The guaranteed specifications are shown in the Specs tab.
Output Power Scaling


Gain

Click to Enlarge
Click for Raw Data
The typical EDFA100S gain as a function of the wavelength. The blue-shaded region denotes the specified operating wavelength range.

Click to Enlarge
Click for Raw Data
The typical EDFA100P gain as a function of the wavelength. The blue-shaded region denotes the specified operating wavelength range.
Noise Figure

Click to Enlarge
Click for Raw Data
The typical EDFA100S noise figure as a function of the wavelength. The blue-shaded region denotes the specified operating wavelength range.

Click to Enlarge
Click for Raw Data
The typical EDFA100P noise figure as a function of the wavelength. The blue-shaded region denotes the specified operating wavelength range.
Femtosecond Pulse Amplification
Compared to booster optical amplifiers (BOAs) and semiconductor optical amplifiers (SOAs), erbium-doped fiber amplifiers (EDFAs) can amplify femtosecond pulses to significantly higher peak power levels. Details on the amplification mechanisms involved are provided in the Amplifier Comparison section at the bottom of this tab.
Below, we present measurements that show how the temporal profile of a 430 fs FWHM input pulse at 1550 nm is affected by propagation through the EDFA100P amplifier.
Experimental Setup
Femtosecond laser pulses centered at 1550 nm were emitted by an erbium fiber oscillator. The 3 dB spectral bandwidth of these pulses was measured to be 9 nm, corresponding to a transform-limited pulse width of 290 fs FWHM; the actual pulse width was measured by an intensity autocorrelator as 430 fs FWHM. The average output power of the fiber oscillator was 1.1 mW. Since the repetition rate of the fiber oscillator was 50 MHz, the measured pulse energy was 22 pJ.
These 430 fs FWHM, 22 pJ pulses were propagated into the EDFA100P amplifier. In some cases, the fiber oscillator was connected directly to the amplifier, while in others, the fiber oscillator was connected to the amplifier through an intermediary dispersion-compensating fiber patch cable. The total output power was varied by adjusting the EDFA100P pump current. We measured the temporal profile of the amplified output pulses as a function of the output power using an intensity autocorrelator.
Results
We characterized the amplified output pulses at three output pulse energies: 0.3 nJ, 0.6 nJ, and 1.1 nJ. The measurements were stopped at 1.1 nJ output pulse energy because nonlinearities appeared in the temporal profile. The data in each graph has been normalized to make the shapes of the autocorrelations easier to compare.

Click to Enlarge
When the amplifier was set to 0.3 nJ output pulse energy, we observed minimal distortion to the temporal profile of the output pulse. The use of a dispersion-compensating fiber (DCF) compressed the output pulse to 150 fs.
| 0.3 nJ Test | Measured Pulse Width (FWHM) | Calculated Peak Power |
|---|---|---|
| Input Pulse | 430 fs | 45 W |
| Output Pulse (No DCF Precompensation) |
570 fs | 0.46 kW |
| Output Pulse (-0.05 ps/nm DCF Precompensation) |
150 fs | 1.76 kW |

Click to Enlarge
When the amplifier output pulse energy was doubled to 0.6 nJ, there was still minimal distortion to the non-precompensated output pulse. By applying precompensation, the output pulse was compressed to 88 fs, but pedestals associated with nonlinearities appeared on the sides. The peak output power in the precompensated case was 6 kW.
| 0.6 nJ Test | Measured Pulse Width (FWHM) |
Calculated Peak Power |
|---|---|---|
| Input Pulse | 430 fs | 45 W |
| Output Pulse (No DCF Precompensation) |
480 fs | 1.1 kW |
| Output Pulse (-0.05 ps/nm DCF Precompensation) |
88 fs | 6 kW |

Click to Enlarge
When the output pulse energy was doubled again to 1.1 nJ, significant distortions appeared in the non-precompensated pulse. Our previous -0.05 ps/nm DCF precompensation led to strong pedestals on the sides. A larger DCF precompensation of -0.14 ps/nm nearly removed the nonlinearities, but the output pulse broadened to 970 fs.
| 1.1 nJ Test | Measured Pulse Width (FWHM) | Calculated Peak Power |
|---|---|---|
| Input Pulse | 430 fs | 45 W |
| Output Pulse (No DCF Precompensation) |
140 fsa | - |
| Output Pulse (-0.05 ps/nm DCF Precompensation) |
80 fsa | - |
| Output Pulse (-0.14 ps/nm DCF Precompensation) |
970 fs | 1 kW |
Conclusion
When the peak power of the output pulse is ~1 kW or lower, nonlinearities in the temporal profile of the output pulse are minimal. (This peak power limit corresponds to a B integral between 1 and 2, below the limit at which nonlinear optical effects can become significant.) As the peak power increases beyond ~1 kW, spectral broadening due to self-phase modulation and other nonlinear optical effects compresses the pulse width and distorts the temporal profile. A careful balance between the initial chirp on the pulse, the amplifier dispersion, and the pulse energy can produce nonlinearly compressed pulses with low distortion.
An example of this is shown in the 0.6 nJ case above. When used with a femtosecond erbium oscillator and a precompensating fiber, the EDFA100P amplifier is capable of producing <100 fs pulses that have peak power of 6 kW. Without a precompensating fiber, the amplifier still provides high gain and minimal temporal distortion by keeping the peak power of the output pulse (and the B integral) below the threshold for nonlinearity.
Amplifier Comparison
Fiber amplifiers such as EDFAs and YDFAs are typically better suited than semiconductor optical amplifiers (e.g., BOAs and SOAs) for amplifying femtosecond laser pulses. These amplifier types differ in their saturation energies, their gain saturation dynamics, and their free carrier lifetimes. In semiconductor amplifiers, the saturation energies are relatively low, on the order of a few picojoules. This limits the amplified pulse energy that can be achieved by semiconductor amplifiers. By way of comparison, in fiber amplifiers, the saturation energies exceed microjoule levels. Additionally, the gain recovery times in semiconductor amplifiers are governed by the carrier lifetime, which is in the 10 ps to 100 ps timescale. The carrier lifetime of fiber amplifiers is typically in the 10 µs to 1 ms timescale.
Consider the case of a mode-locked femtosecond laser with a repetition rate on the order of 1 MHz. For pulse energies well below the saturation energy of the semiconductor amplifiers, the pulses will be amplified with minimal distortion. However, once the pulse energy exceeds the saturation energy, the amplification will saturate during the pulse, leading to a gain difference over the pulse's temporal profile and distorting the pulse shape. Since fiber amplifiers have higher saturation energies than semiconductor amplifiers, they are less prone to experience gain saturation by this mechanism.
Because the gain recovery time of a semiconductor amplifier (10 ps to 100 ps timescale) is shorter than the repetition period, the gain medium recovers before the next pulse in the pulse train arrives at the semiconductor amplifier. Therefore the same process is repeated for each pulse. In fiber amplifiers, the free carrier lifetime (10 µs to 1 ms timescale) is much longer than the repetition period. Consequently, fiber amplifiers can be thought of as responding to the pulse's average power, as opposed to its peak power.
An additional point that is especially relevant to femtosecond pulses is the role of nonlinear processes in the amplifier. While the nonlinear response of a fiber amplifier is almost instantaneous, the nonlinear response time of a semiconductor amplifier is in the 10 ps to 100 ps timescale, as it is related to its carrier lifetime. This ps timescale represents another source of pulse distortions when the pulse energy exceeds the saturation energy.
EDFA100x Drivers
Version 2.12.18
Includes drivers required to control our EDFA100x fiber amplifiers in a Windows® environment.
Shipping List
Item #'s EDFA100S and EDFA100P consist of:
- Erbium-Doped Fiber Amplifier in Benchtop Package
- Amplifier Enable Key (Qty. 2)
- Interlock-Shorting Pin
- FBC250 Bulkhead and Connector Cleaner
- Region-Specific Power Cord
- Printed Manual
| Posted Comments: | |
Nicolas Forget
(posted 2019-10-28 17:09:49.317) Hi, I would like to know whether the EDFA100P can be used both ways, ie with light coming in from both the input and output ports.
Best regards, Nicolas YLohia
(posted 2019-10-29 11:10:36.0) Hello Nicolas, the EDFA is not bidirectional -- the input must be supplied via the "Input Port". If you require a bidirectional operation, then our semiconductor optical amplifiers such as the SOA1117P would be a better fit. The SOA is built with a symmetric structure, so when operating in the reverse direction, the gain will stay the same but saturation power and noise figure may be different. Tiong Leh (Johnny) Yap
(posted 2019-10-16 18:17:04.947) Hi,
I would like to ask for quotation for EDFA100S.
Thank you.
Regards,
Johnny YLohia
(posted 2019-10-16 10:51:11.0) Hello Johnny, thank you for contacting Thorlabs. Quotes can be requested by emailing our Sales Team at sales@thorlabs.com or selecting "Request Quote" from your cart. Yohan Barbarin
(posted 2019-10-08 03:07:20.72) Dear,
We have an issue with the interlock. It looks like it is only mecanical and not electronical.
Could you please give us more information about the electrical specs of the interlock input.
Best regards,
Yohan YLohia
(posted 2019-10-08 02:33:52.0) Hello Yohan, thank you for contacting Thorlabs. The electrical specs for the interlock can be found on Page 10 of the manual: https://www.thorlabs.com/_sd.cfm?fileName=TTN118382-D02.pdf&partNumber=EDFA100S user
(posted 2019-09-04 08:30:52.267) Please can you provide advice on the lowest input power to use with the EDFA100S ?
For example, do you have a graph to show how the SNR in the output varies as a function of the input power ?
The wavelength I want to use is 1550 nm.
I would like to consider input powers down to - 40 dBm, maybe even lower. I notice your graph stops at minus 30 dBm.
Thank you asundararaj
(posted 2019-09-12 01:39:32.0) Thank you for your feedback. The EDFA100S can be seeded with -40 dBm input power. However, the SNR of the output will be reduced as input power is increased. I have contacted you directly to discuss this further. cees de Kok
(posted 2019-03-13 03:54:32.757) We are considering the purchase of the EDFA100P.
We are also working at wavelength on or a little bit below 1520 nm. The gain curve in the documentation which goes as low as 1525 nm seems to still not go down very steeply below 1525...
So my question is: do you have gain-data for 1520 nm or even lower? llamb
(posted 2019-03-15 08:29:36.0) Hello, thank you for your feedback. I have emailed you directly with additional data. k.l.perrier
(posted 2019-03-06 11:08:13.807) We are interested in the Gain and Noise spectrum below 1525nm. Is it possible to provide us the graphs from 1490nm-1570nm or similar range?
Thank you llamb
(posted 2019-03-15 08:23:53.0) Thank you for contacting Thorlabs. I have reached out to you directly with further data. |