 Products Home
O-Band Fiber Amplifier (PDFA)

- Polarization-Insensitive Gain
- Ripple-Free Gain Spectrum
- No Cross-Gain Modulation, Pattern Dependence, or Modulation Format Dependence
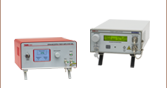
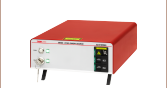
PDFA100
Single Mode PDFA, FC/APC
50 GBaud/s PAM4 Eye Diagram from the PDFA100
See the PDFA vs. SOA Tab for Details


Please Wait

Click to Enlarge
Typical gain spectrum for the PDFA100 optical amplifier. A complete set of performance graphs is available on the Graphs tab.

Click to Enlarge
Operating Principle of the PDFA
Features
- Operating Wavelength Range: 1280 - 1330 nm (O-Band)
- >20 dB Small Signal Gain
- >16 dBm Output Power
- <8 dB Noise Figure
- Minimal Signal Latency
- Operates in Constant Current, Power, or Gain Modes
- OEM and Customization Options Available; Contact Tech Support for Details
Applications
- O-Band Signal Transmission for Data Communications
- Overload Testing of O-Band Receivers
- Ideal for Use as a Preamplifier or Booster Amplifier
Thorlabs' Praseodymium-Doped Fiber Amplifier (PDFA) offers high gain (>20 dB small signal gain), high output power (>16 dBm), and a low noise figure (<8 dB), making it ideal for use within optical networks as either a booster amplifier or preamplifier. As Pr ions in silica transition to a lower excited state nonradiatively, these PDFAs are designed and manufactured by Thorlabs using proprietary fluoride fiber. Please see the PDF Emission tab for more information on light emission in Pr-doped fluoride fibers (PDF). The PDFA incorporates a relatively short length of PDF, which results in a signal latency <100 ns.
Fiber amplifier technology offers key advantages over semiconductor optical amplifiers (SOAs) when used for boosting communication signals. Distortion effects typically associated with the saturation mechanism and gain dynamics of SOAs do not exist in PDFAs, leading to improved compatibility with wavelength division multiplexed systems, advanced modulation formats, and high data rates. In particular, undesirable distortion effects such as cross-gain modulation and pattern dependence are eliminated in the PDFA as a result of its high saturation energy and slow gain dynamics. The PDFA gain dynamics are independent of pulse shape or modulation format due to a long upper-state lifetime that leads to negligible cross-talk between adjacent channels. For a comparison between the resulting PDFA and SOA eye diagrams, please see the PDFA vs. SOA tab. Featuring a ripple-free, or flat, gain spectrum, the PDFA produces uniform gain over a number of channels, which eliminates channel mismatches at the end of a link. The resulting clean, stable output is ideal for improving the power budget in data center applications.
As shown in the schematic to the right, the main components of the PDFA include a wavelength-division multiplexer (WDM), input and output isolators, and a PDF. The WDM is used to combine the pump laser and O-band signal light before the PDF, while the isolators, which only allow light to travel in one direction, prevent lasing by minimizing back reflections. The input and output isolators also serve to prevent any spontaneous emission signal from entering the amplifier and the pump light from exiting the amplifier, respectively.
Each fiber amplifier is enclosed in a compact benchtop package with FC/APC (2.0 mm narrow key) input and output connectors. The instrument's front panel includes an adjustment knob for tuning the pump current of the PDFA. This device also features a display screen that shows the pump level, as well as the temperature and emission status. To show when the internal laser is active, an indicator LED is included on the enable button; this will blink rapidly for three seconds before the amplifier turns on. For additional safety, the user may connect an interlock circuit to the BNC connector on the rear panel.
The PDFA uses a universal power supply allowing operation over 100 - 240 VAC without the need to select the line voltage. A region-specific power cord is included.
Operation Modes
The PDFA can be operated in three modes, including automatic current control (ACC), automatic power control (APC), and automatic gain control (AGC). ACC mode drives the pump current in the PDFA at a fixed current level and is accessible through the instrument’s front panel. The user can vary the gain and output power level of the instrument by adjusting the pump current level. This fiber amplifier can also be operated in APC or AGC mode, which maintain fixed output power or fixed gain, respectively. Note that these two operation modes are only accessible through a command-line interface; the PDFA can be connected to a PC via the USB port on the back panel of the instrument.
The command line interface can also be used to enable or disable the amplifier, set the current level in the ACC mode, or read status indicators. The indicators available through the USB interface include temperature error, interlock status, and emission status. For more details on these features, please refer to the instrument manual.
For applications that require PDFAs with custom form factors, power consumption, or optical specifications, please contact Tech Support. Thorlabs also offers Ytterbium-Doped Fiber Amplifiers (YDFAs) and Erbium-Doped Fiber Amplifiers (EDFAs), which operate in the 1025 - 1075 nm and 1530 - 1565 nm (C-band) wavelength ranges, respectively.
| Item # | PDFA100 | |
|---|---|---|
| Amplifier Specificationsa | ||
| Operating Wavelength Rangeb | 1280 - 1330 nm (O-Band) | |
| Input Power Range | -30 - 10 dBm | |
| Output Power (@ 3 dBm Input Power)c,d | >16 dBm | |
| Small Signal Gain (@ -30 dBm Input Power)c | >20 dB | |
| Noise Figure (@ -30 dBm Input Power)c | <8 dB | |
| Laser Class | 1M | |
| Fiber Specifications | ||
| Polarization-Dependent Gain | <0.5 dB | |
| Return Loss at Input Port | >50 dB | |
| Input / Output Isolation | >30 dB | |
| Input / Output Fiber Type | Single Mode | |
| Input / Output Fiber Connectors | FC/APC Compatible, 2.0 mm Narrow Key | |
| Absolute Maximum Ratings | |
|---|---|
| Absolute Maximum Input Power | 10 mW (10 dBm) |
| Absolute Maximum Output Power | 150 mW (22 dBm) |
| Operating Temperature | 15 to 30 °C |
| Storage Temperature | -10 to 40 °C |
| General Specifications | |
|---|---|
| Input Voltage | 100 - 240 VAC, 50 - 60 Hz |
| Input Power | 20 W (Max) |
| Fuse Rating | 2 A, 250 V |
| Fuse Type | Time-Lag (Slow-Blow) |
| Fuse Size | 5 mm x 20 mm |
| Dimensions (W x D x H) | 250.0 mm x 300.0 mm x 122.2 mm (9.84" x 11.81" x 4.81") |
| Weight | 3.4 kg (7.5 lbs) |
Performance Graphs
Performance may vary from unit to unit; this data reflects the typical performance of our PDFAs, and is presented for reference only. The guaranteed specifications are shown in the Specs tab.
Wavelength Dependence
Click to Enlarge
Click for Raw Data
The typical gain as a function of the wavelength. The blue-shaded region denotes the specified operating wavelength range. Data is measured with the pump level set at 100%.

Click to Enlarge
Click for Raw Data
The typical noise figure as a function of the wavelength. The blue-shaded region denotes the specified operating wavelength range. Data is measured with the pump level set at 100%.
Input Power and Pump Level Dependence at 1310 nm

Click to Enlarge
Click for Raw Data
The typical output power as a function of input power at 1310 nm. Data is measured with the pump level set at 100%.

Click to Enlarge
Click for Raw Data
The typical noise figure as a function of input power at 1310 nm. Data is measured with the pump level set at 100%.

Click to Enlarge
Click for Raw Data
The typical gain as a function of input power at 1310 nm. Data is measured with the pump level set at 100%.

Distortion-Free Amplification

Click to Enlarge
50 GBaud/s Eye Diagram for a Commerically Available SOA

Click to Enlarge
50 GBaud/s Eye Diagram for the PDFA100 Fiber Amplifier
One advantage of Praseodymium-Doped Fiber Amplifiers (PDFAs), in comparison to semiconductor optical amplifiers (SOAs), is their slow gain dynamics. Communication signals include pulse sequences with random patterns. In the simple case of an on-off-keying (OOK) and non-return-to-zero (NRZ) format, the pulses have identical amplitudes but their width can vary from one bit period (20 ps for 50 Gb/s data rate) to many bit periods, depending on the type of data being transmitted. As a result, if the amplifier gain saturation has a time constant comparable to the bit period, the gain of the amplifier exhibits pattern dependence. This effect can result in severely distorted optical signals when the amplifier is driven into saturation. SOAs typically have carrier lifetimes on the order of tens of picoseconds, and pattern dependence is observed at standard communication data rates when they are driven into saturation. In contrast, PDFAs have an upper-state lifetime in the millisecond range, which makes them immune to this pattern dependence. This distinguishing characteristic between SOAs and fiber amplifiers has been previously studied for OOK with return-to-zero (RZ) and NRZ modulation formats1. Signal distortion becomes a more severe issue in modern modulation formats, such as 4-level pulse amplitude modulation (PAM4).
The two diagrams shown above are measured by amplifying a 50 GBaud/s PAM4 signal with a 27-1 pseudo-random bit sequence (PRBS) using both a Thorlabs' PDFA100 amplifier (left) and a commercially available SOA (right). The output power from both amplifiers is set to 10 dBm, and the output signal from each amplifier is attenuated and sent into a high-speed receiver. A comparison of the two diagrams illustrates that the PDFA produces an open eye diagram with minimal distortion, while the SOA saturation dynamics cause significant distortion to the eye diagram. These eye diagrams were measured using Thorlabs' MX65E-1310 65 GHz Linear Reference Transmitter and RXM40AF Ultrafast Receiver.
Footnotes
- R. C. Schimmel, R. J.W. Jonker, P. K. van Bennekom, Giok-Djan Khoe, and H. de Waardt, "Experimental assessment of 1.3-µm telecommunication systems incorporating a praseodymium-doped fiber amplifier (PDFA)," Proc. SPIE 4833, Applications of Photonic Technology 5, 2003.
The Praseodymium-Doped Fluoride Fiber Amplifier (PDFA) achieves signal gain through stimulated emission, which is when an incident photon causes an excited-state ion to relax to a lower energy state by emitting a photon. For this fiber amplifier, silica cannot be used as the host material because the excited state decays to the ground state nonradiatively via phonon relaxation. Materials with lower phonon energies, such as fluorides or chalcogenide glasses, are more suitable hosts. Thorlabs uses proprietary fluoride fiber doped with the rare-earth metal praseodymium to generate radiative emission and achieve signal gain.

Click to Enlarge
Schematics showing Pr3+ ion excitation and emission processes. 3H4, 3H5, and 1G4 are the ground, intermediate, and excited energy levels, respectively.
Stimulated Emission in the PDFA
The excitation and relaxation process in the Pr3+ ion behaves like a three-level system involving the ground state 3H4, metastable state 1G4, and intermediate state 3H5. In particular, when a ground state Pr3+ ion is pumped with a laser, the ion is excited to a metastable state with a long lifetime on the order of hundreds of microseconds. This long lifetime allows for population inversion, which means that the number of ions in the metastable state builds up and becomes larger than the number of ions in the ground state. The ion sits in the metastable state until a signal photon, with an energy matching the energy difference between the excited state and intermediate state, causes the ion to relax down to its ground state by photon emission. For the Pr3+ ion, this energy corresponds to a wavelength around 1.31 µm. The ion then fully decays to the ground state through nonradiative phonon relaxation. Absorption and stimulated emission, as well as the relevant energy states, are illustrated in the first two panels of the schematic to the right.
Note that the electronic states of the Pr3+ ion are energy bands and not discrete energy levels, and there is a range of wavelengths the emission processes occur over, i.e. the PDFA bandwidth. This is as a result of the Stark-splitting caused by the local electric fields from the surrounding host lattice acting on the Pr3+ ion, as well as site-to-site variation within the amorphous host.
Stimulated vs. Spontaneous Emission
Signal amplification occurs when the ion relaxes via stimulated emission because one signal photon in results in two signal photons out; this second photon has the same energy, phase, and direction as the incident signal photon (coherent radiation). If the excited ion is not triggered during the span of the metastable state lifetime, the ions relax on their own via spontaneous emission. As shown in the last panel of the schematic, these photons have random phase and direction. While most of the photons generated by spontaneous emission will leave through the sides of the fiber, some propagate through the fiber core and experience signal gain, resulting in noise called amplified spontaneous emission (ASE).
Front and Back Panels

Click to Enlarge
Back Panel

Click to Enlarge
Front Panel
| Back Panel | |
|---|---|
| Callout | Description |
| 1 | USB Port for Diagnostics and Remote Interface |
| 2 | AC Power Cord Connector |
| 3 | Fuse Tray |
| 4 | AC Power Switch |
| 5 | Remote Interlock Input (BNC) |
| Front Panel | |
|---|---|
| Callout | Description |
| 1 | Push-Button Power Switch |
| 2 | Display to Show Pump Level, Temperature Status, and Emission Status |
| 3 | Control Knob to Adjust Pump Laser Current |
| 4 | Amplifier Enable Switch and Emission Indicator |
| 5 | Optical Output for Single Mode FC/APC Fiber Connector |
| 6 | Optical Input for Single Mode FC/APC Fiber Connector |
The PDFA100 contains the following components:
- Praseodymium-Doped Fiber Amplifier in Benchtop Package
- Interlock-Shorting BNC Connector
- Region-Specific Power Cord
- USB Cable
- FBC250 Connector and Bulkhead Cleaner
| Posted Comments: | |
| No Comments Posted |